

In this article, we describe what Dynamic Time Wrapping is and how it can benefit you.
Grocery store observation: An increase in milk sales in any given week is followed—one week later—by an increase in cornflakes sales.
Instinctively, it looks like a pattern, doesn't it? When sales of Product A increases, I expect sales of Product B to increase next week. Let's call this pattern a "product cluster." It's just separated by time.
Now if we could find such product clusters, we could then do things like:
- Execute marketing campaigns based on purchase patterns to increase Marketing ROI
- Optimise restocking activities
- Clear slow-moving stock with product bundles consisting of fast and slower moving item(s).
E.g. KFC Buddy Meal always comes with nuggets that nobody normally orders. - Encourage extra purchasing with product bundles of items with similar purchasing patterns but with a little delay. E.g. Milk cartons are usually promoted in pairs even though they expire at the same time.
But how do we find these clusters of products (and will there be many, many clusters!)? Enter Dynamic Time Warping (DTW), a time-series analysis to unearth these time-based insights.
For the rest of this post, we’ll discuss DTW and how it applies to a retail store. While it's used heavily in consumer-centric industries (e.g. supermarkets), we can apply the same principles to B2B industries and marketing—after all, time does control purchase behaviours.
What is Dynamic Time Warping?1
Skip to How We Do It if you know Dynamic Time Warping & Time-Series Analysis
Dynamic Time Warping is NOT Star Trek Warping (when Captain Kirk and crew jump back in time to save Humpback whales). DTW is a time-series analysis method that finds consumption patterns.
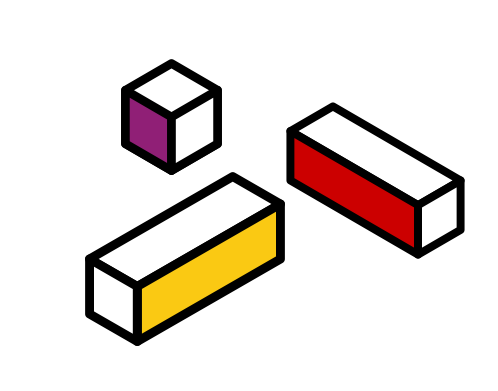
We at Construct Digital—at least our Slash-look-alike—love milk and cornflakes. We took Slash’s guitar and forced him to record his milk and cornflakes consumption for a month for this article [ed's note: Oh, the things we do…].
As we see in supermarkets, a pack of cornflakes is far larger than a carton of milk. So, our guy doesn’t necessarily finish all the cornflakes and all the milk at the same time. The chart below records his milk and cornflake consumption rate for a month. M indicates Milk finished; C indicates Cornflakes finished.
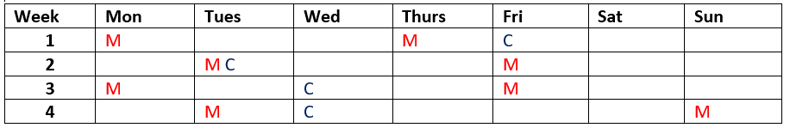
As you can see, milk always finishes faster than cornflakes. This will surely affect his buying pattern. On some grocery days, he may have to purchase more cornflakes than milk; on other days, maybe he buys the same quantity of milk and cornflakes.
If we extended this to his milk and cornflakes purchases over 25 weeks, it would look something like this:
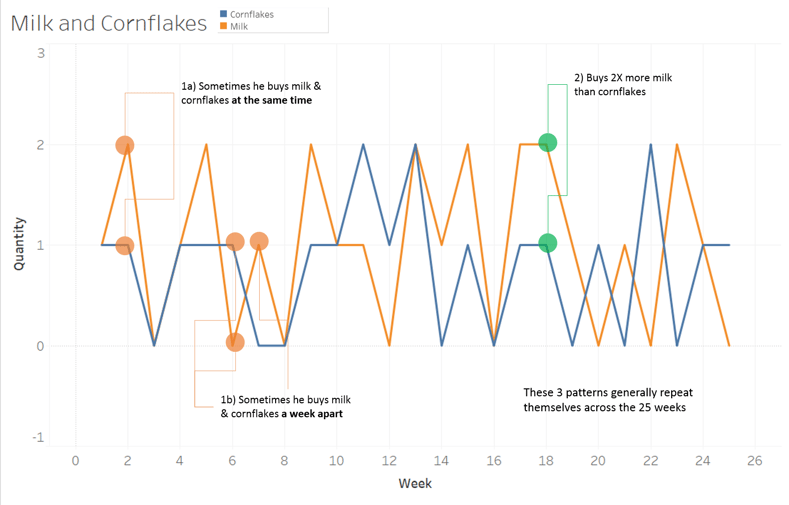
Here, you can see that his milk and cornflakes buying behaviours are similar. When he buys milk, it is likely that he will buy cornflakes either at the same time or during the following week, and vice versa. We also see that he buys twice as many cartons of milk as packs of cornflakes.
Basically, milk and cornflakes have similar purchase patterns but they’re bought at different start times and quantity.
Think back on your own grocery shopping. I bet it probably follows the same behaviour—delayed purchases; when buying a particular product, we might buy more of another too. That’s our shopping intuition kicking in. This intuition powers Dynamic Time Warp.
DTW essentially encodes our milk and cornflakes intuition into a generalised algorithm that can be used on other products. The algorithm is commonly used in retail (see our example), but it is far more extensible.
It sees usage in fraud detection of dinancial markets; tracking product movement for logistics suppliers and inventories; EEG & ECG anomaly detection in healthcare; urban planning using social media for city planners; not to mention speech, video, and image recognition. Now that’s plenty of applications for one time-series algorithm!
When then, do I use DTW? Perhaps this might help you decide it's the right algorithm for you:
DTW takes “data that happen sequentially in time to measure their similarity.
Let’s see how this applies in a retail setting.
How We Do It: DTW, Retail & Bundles of Joy
Imagine…a mega supermarket, and they want to know which products (out of their thousands of products) commonly run out in the same pattern. For example, A bag of rice has the same pattern as… (Butter? Cooking Oil? Washing Liquid? Can we find this out?).
Before we start, we ask:
- How do we sift through the thousands of products to identify these patterns?
- How do we identify product time series bundles from thousands of products? The possibilities are nearly endless!
- How do we know if our product bundles are correct?
You need a time-series dataset (we'll use the grocery chain Favorita from Kaggle) and a data mining tool (such as SAS Enterprise Miner).
Our method looks like:
- Review Dataset & Find Focus
- Use DTW to Find Product Bundles & Patterns
- Suggest Actions based on Findings
1. Review Dataset & Find Focus
We’re using a Kaggle dataset "Favorita," a grocery chain based in Ecuador, for this exercise. First, we need to find a target for our behavioural pattern.
There were many Favorita stores across the country, and each store sells many items. For simplicity, we use only the store with the greatest transaction volume: Store No. 44.
Focus 1: Store No. 44 based on transaction volume. The higher, the better
 |
Let’s look at their sales volume over 5 years. As you can see, 2016 looks like a good year!
But upon closer examination, we found that an earthquake had occurred on 3 April 2016. This natural disaster would affect our study across the year.
Hence, we dropped 2016 and 2017 (incomplete data as it stopped in August), and used 2015 data instead. |
Focus 2: Use 2015 data. Complete data without external occurrences.
Now, let’s look at Store No. 44’s 2015 transaction data.
|
|
|
|
|
|


Let’s use item 1047679 as our product target to find other products with similar transaction patterns.
Focus 3: Item 1047679. Highest transacted item.
By now we’ve reviewed the dataset and found our analysis foci (Store No. 44, 2015 Data, item 1047679).
2. Use Dynamic Time Warp to Find Product Bundles & Patterns
The good thing about SAS Miner is that we can just plug the data into the model and “play it out” (as shown in our SAS Miner dashboard below).
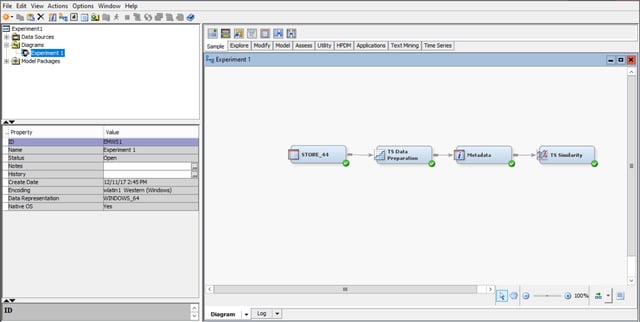
After running through our DTW model, we find that amongst all 4,100 items in the grocery dataset, item 1473474 (Produce) had the most similar transaction patterns as our target, Item 1047679.
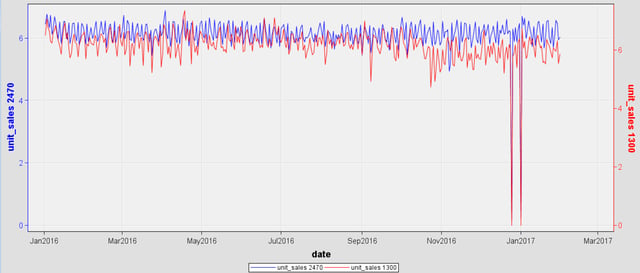
That’s a start. Let’s confirm this by plotting items 1473474 (identified product) and 1047679 (target product) across 2015. We expect to see similar transaction patterns for both items (i.e. if one goes up, the other would too; and vice versa).
 Purple line: Item 1047679 (target product) | Yellow line: Item 1473474 (Identified product)
And they do! Both lines tend to go up and down at almost the same time with occasional delays. Note: Favorita only started selling Item 1473474 (Produce) from 1 June 2015 onwards.
We could repeat DTW for products with the next highest transactions and so on until we have exhausted the store’s stockist.
3. Suggest Actions Based on Findings
So we know that Item 1047679 (target product) has similar transaction patterns as Item 1473474 (Identified product). Now we act on this insight. A few ideas come to mind:
- Time Store No. 44’s marketing
The items’ transaction patterns are quite similar; the store can focus their marketing on only one of these items but get double returns. - Optimise restocking activities
Having similar transaction pattern would mean they have similar restocking cycles; the store can optimise their restocking activities around items with similar time series bundles. - Develop product bundles with hangers-on
We can create product bundles that include these two items with another slower moving item. This helps to clear store stock. - Develop product bundles with hangers-on 2
Create product bundles of items with similar purchasing patterns but with a little delay. This encourages over-purchasing.
Hopefully, we’ve shown how Dynamic Time Warping can be used to identify products with similar time trends. Of course, it can be used in other areas such as finance, healthcare, and more.
Finally, if you’re looking to program your own Dynamic Time Warping applications, check out these R DTW & Python DTW examples and references.
Image credit
Cover image from PxHere
1 Not to be confused with Market Basket Association
Data@Construct: Forge Better Decisions
We run weekly Data Science Experiments to help marketers use data to increase their Digital Marketing ROI and Effectiveness. Sometimes we’ll do wacky stuff, sometimes we’ll focus on common business and marketing problems, but always, we’ll share our learnings here on our blog.
Please subscribe to our Email Updates for weekly updates and learnings.
If you’ve got a marketing data problem that needs cracking, we’d love to hear from you.
More insights