Content Outline
We've said "there's an app for that" so much that today, the phrase stands as an adage to apps being the digital solution for real world needs. So, one day you connect your new needs to an app, and go browsing for one. What is the first thing you'd see? Most likely, it would be the app’s rating.
Given a choice, most consumers would be more likely to download an app with a good 4-5-star rating rather than one with 3 stars and below. After choosing the best rated app, the next thing to look at are its reviews, then its size, its price etc. It becomes quite evident that there are plenty of aspects that someone looks at before hitting a download button

Screen grab of Google Play on a browser
With this in mind, we asked ourselves - what affects an app’s rating on the app store? Even with some theories in mind such as app ratings or app size, how do we prove and quantify this? Consequently, could we predict ratings using these factors?
We decided to find out, with data.
In this article, we used Python and a dataset of Google Play Store Apps from Kaggle. Using basic Exploratory Data Analysis (EDA) and a basic predictive model, we explore what factors can affect an app’s rating.
Exploratory Data Analysis: Sifting Through App Store Data
Initially, we had 10,840 rows of data with 13 columns. After cleaning the numbers, we reduced the set to 8,870 rows with 11 columns. First up, we looked at the spread of the ratings of the various apps in the dataset.

Box plot of Rating
What can we tell from this? Most apps have a rating of 4 or more. The average rating in the dataset is around 4.19.
Also, using Google Play on your browser, you are able to filter out apps that have less than 4 stars!

Screen cap of Google Play on a browser
So what? When launching an app, aiming for a rating of over 4.3 ensures positive visibility and a rating that’s higher than 50% of the apps out there.
How do we achieve this? Let us look at the relationship between the ratings and the other aspects of the app.
Correlation Matrix
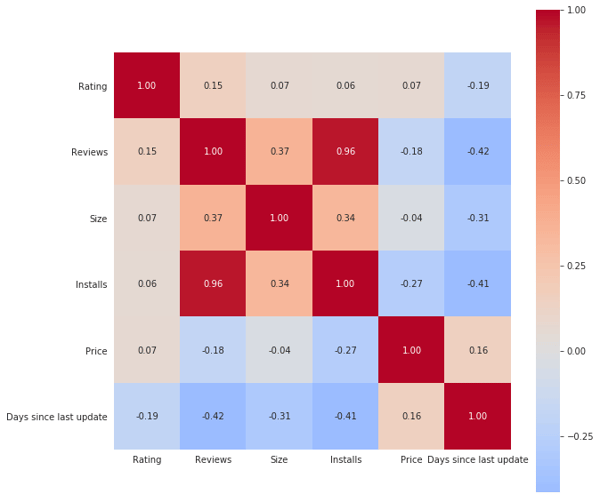 Heatmap of correlation matrix of the data set
We created a correlation matrix in Python and plotted it as a heat map, which gives us an overall view of the relationship between each column in the data set. A value closer to 1 or -1 indicates a strong positive or negative correlation between two columns. Some of these seemed obvious, where ‘Reviews’ and ‘Installs’ are positively correlated, ‘Days since last update’ and ‘Reviews’/’Installs’ are negatively correlated.
What is interesting is how ‘Size’ is positively correlated with ‘Reviews’ and ‘Installs’ and negatively correlated with ‘Days since last update’; this could mean that a larger app might have better design/ features, leading to more time between updates and garnering more reviews and installs.
With this in mind, let’s try using a couple of models to see if we can predict an app’s rating with existing data.
Note: A positive correlation between A and B means that as A increases, B increases. A negative correlation means as A increases, B decreases or vice versa. Also, you may have heard the saying “correlation is not causation”, which is just a fancy way of saying “don’t draw conclusions just because two features are correlated with each other; this is just the start”
Machine Learning (ML)
We converted the ‘Type’, ‘Content Rating’ and ‘Category’ columns to dummy variables. Using this ‘refurbished’ data set, we used Linear Regression (LR) and the Random Forest Regressor (RFR) to try to predict an app’s rating. You can find the code in our GitHub repository and more information on what these ML techniques are here.

Linear Regression and Random Forest Regressor example
The accuracy of these techniques can be verified using the Mean Absolute Error (MAE). Simply put, this is the difference between the predicted rating and the actual rating and what we want is to have this value be as small as possible. The results show both models performed similarly, with the RFR performing slightly better than LR.
This sample shows that AI can predict the rating within +/- 0.3265 points of its actual rating (e.g. if an app’s actual rating is 3, the RFR model will predict between 2.6735 and 3.3265).
We see that even with a small correlation between ‘Rating’ and the other columns (as shown above in the heat map that we plotted), we are able to perform a simple prediction. Generally, we can improve performance by adjusting the technical parameters, trying other techniques, or adding more data.
Our findings
So, what have we learned from this dataset?
1.
‘Reviews’, ‘Size’, ‘Installs’ and ‘Price’ are positively correlated with ‘Rating’
2.
‘Days since last update’ however, is negatively correlated
3.
Prediction of ‘Rating’ is possible using ML techniques (though the performance could be improved as stated before)
Some of these insights might seem like common sense, but now we actually have data to back it up. What we have done here is a surface level analysis and in reality, we would run more extensive analysis and test more models.
Using this baseline data, you can now know for sure, definite factors in order to get higher ratings for your own app.
We hope that with these examples, you get a taste of the power behind using analytics and predictive modelling.
Data @ Construct
This is just a small glimpse into the types of analysis and insights we can derive from a set of data. To find out more about other ways we can help solve some of your other problems (such as creating and managing your data pipeline, deriving insights from customer data, and predicting sales decisions from your sales data), drop us a line for a chat. We’re friendly. Promise.
While you're at it, check out our recently concluded data analysis of over 2.8 million Singaporean user's traffic, to give insights into Singaporean Browsing share in 2018 here.
Additional Reading:
- 1. Original data set: https://www.kaggle.com/lava18/google-play-store-apps
- 2. Why correlation is not causation: https://towardsdatascience.com/why-correlation-does-not-imply-causation-5b99790df07e
- 3. Different types of AI/ML techniques: https://www.mckinsey.com/business-functions/mckinsey-analytics/our-insights/an-executives-guide-to-ai
About the Author
Lian Kai Neow
Aspiring data person, on his long and never-ending journey to learn everything and anything related to data. Side tracking every now and then to read, play and work out.

Guide
Assess Your IMPACT
Try our IMPACT scorecard to discover how your marketing stacks up across our six-pillar framework. Get a data-driven scorecard that identifies gaps and opportunities for measurable growth.