_Colored_Full_Transparent.png?width=1754&name=Construct%20Digital%20Logo%20(RGB)_Colored_Full_Transparent.png "Construct Digital Logo (RGB)_Colored_Full_Transparent")

Are you a marketer or developer looking for some insights into the mobile industry, before building your new mobile application or website?
Perhaps you are working with resource constraints and need to prioritise the gargantuan task of building, optimising and keeping updated (and compatible) a mobile application or site.
Maybe you already have a digital asset accessible on mobile screens that you'd like some insight into what to optimise for first?
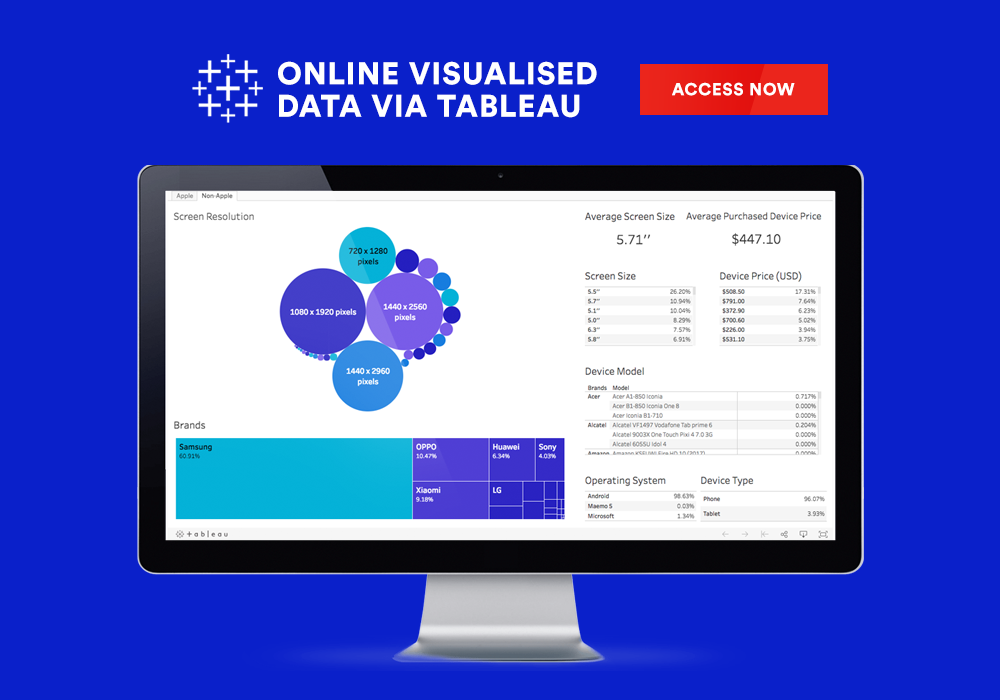
Whatever the case may be, this is the white paper for you. Filled with usage graphs and statistics compiled through an analysis of over 2.8 million users over a span of 6 months, this document is the bible of mobile resource for Singapore.